

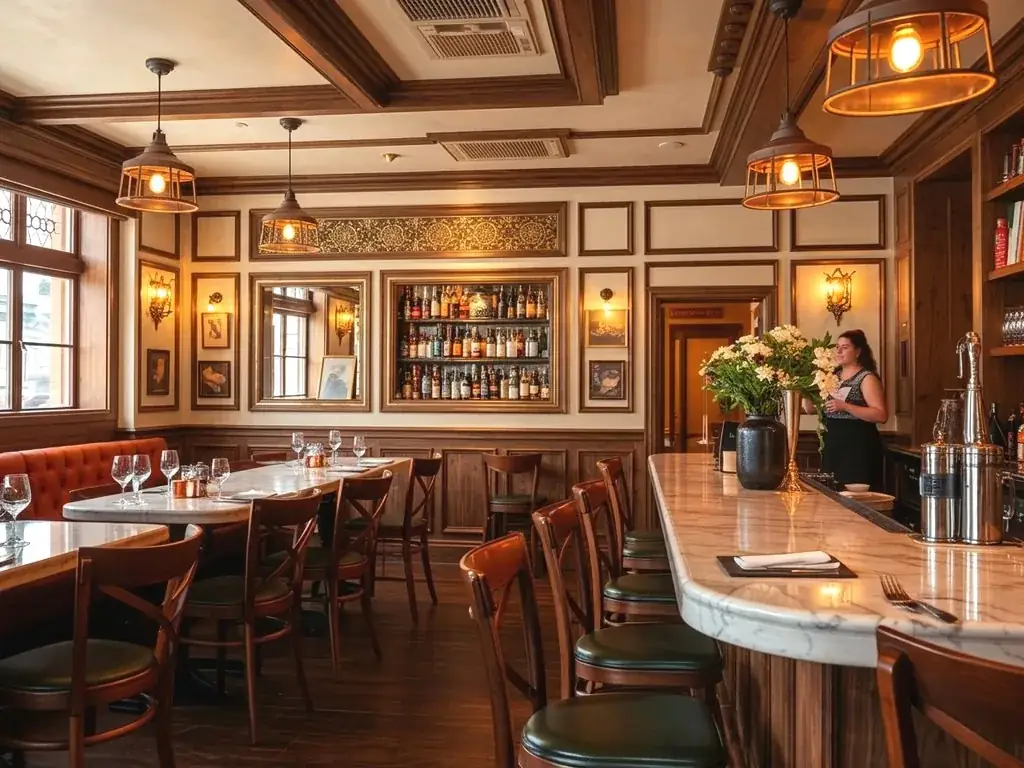
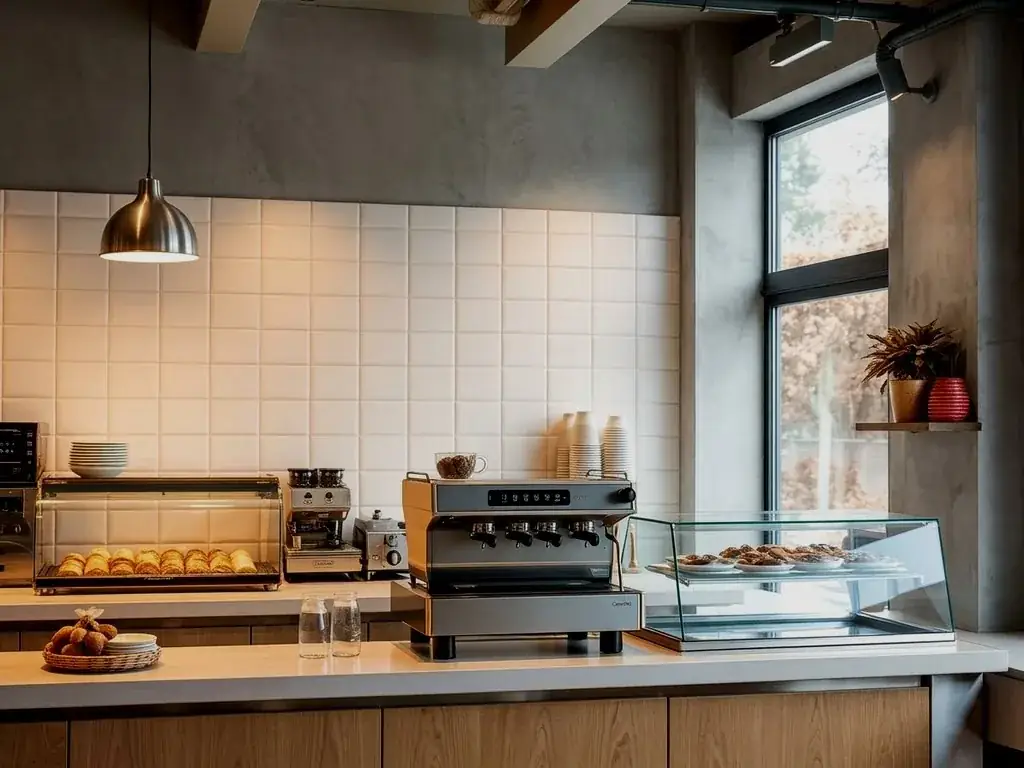

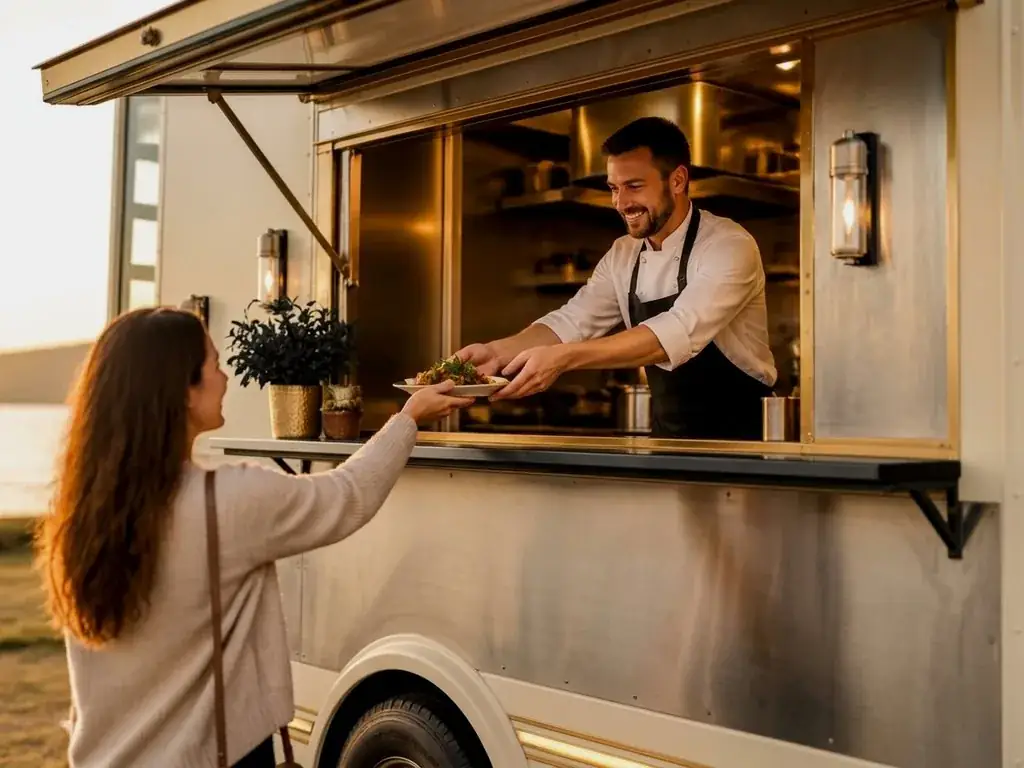
Average restaurant food cost percentage by format
· 6 min readAverage restaurant food cost runs 22–40% of sales depending on format. See the benchmarks by format, what belongs in the number, and how to close a gap.
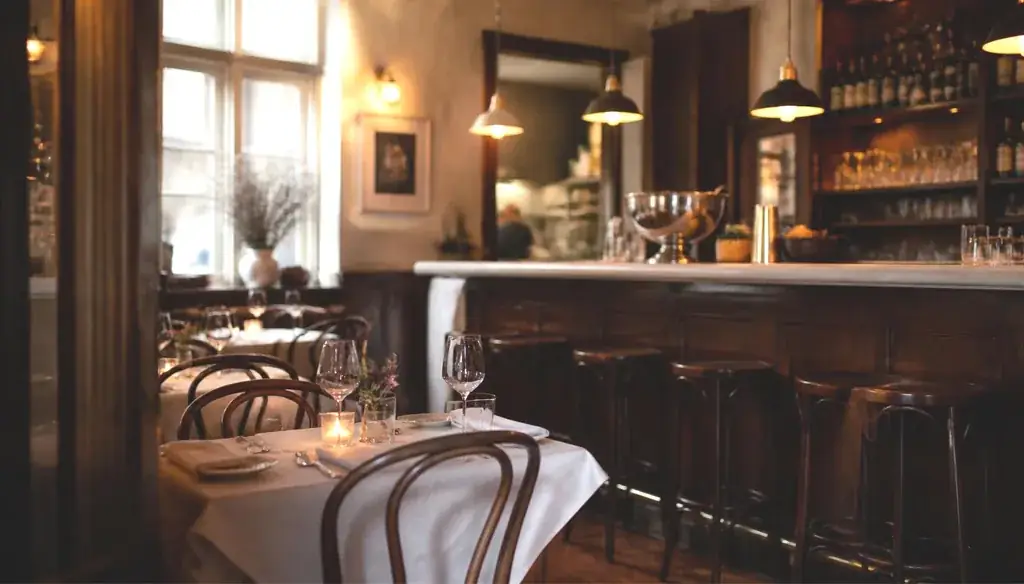
Independent restaurant consultants for restaurants, bars, bistros, coffee shops and food trucks. Start with a free restaurant margin review — we rebuild the menu, labor model and cost structure that drive margin.
No cost, no obligation — benchmarked against your format.
Prime cost target
Under 60%
Hospitality Growth Advisors is a restaurant consulting firm serving independent restaurants, bars, bistros, cafés and food trucks across Texas, Florida, South Carolina and North Carolina. We focus on strategy, operations and profitability — the three systems that decide margin. See the sectors we support, client results and fixed-fee pricing.
Two-minute margin health check — three numbers from a recent week, and we’ll show your prime cost against healthy benchmarks.
Run the health checkIllustrative & Modeled Outcomes
See the case studiesPrime cost
Check average
Annualised recovery
Measurement cycle
Illustrative / Modeled Outcome
Illustrative example based on modeled assumptions and/or scoped engagement scenarios. Results are not guaranteed and actual outcomes vary. Disclaimer
Why HGA
Three partners. One practice. No junior analysts. Your engagement is led by the senior team that diagnoses the problem, works alongside your managers and measures the change.
Report delivery is the main endpoint.
On-site execution: put the agreed changes into live service.
Hourly billing can leave the final cost open-ended.
Fixed scope: agree the deliverables and fee before work begins.
Day-to-day work may be delegated to junior staff.
Senior operators: direct access to the partners doing the work.
Recommendations leave implementation with your team.
Manager training: practice recipes, prep, scheduling and reporting with your team.
Success is measured by completing the report.
Margin-focused: track prime cost, labor productivity and menu contribution.
Post-project measurement may be outside the scope.
90-day measurement: compare progress with your baseline and adjust the plan.
Comparison describes a report-led engagement, not every consulting firm. On-site work, training and follow-up are defined in your scope; the 90-day cycle measures progress, not a guaranteed result.
A defined scope and fee before work begins. A clear owner for implementation. Prime cost, labor and menu margin tracked against your starting numbers.
Who we work with
All sectorsFilm
A quick look at how our systems help operators increase margins and strengthen day-to-day performance.
Most restaurants, bars and coffee shops do not lose money because the food is wrong. They lose it in the gaps — a menu priced on instinct, labour scheduled to a habit rather than to covers, invoices nobody reconciles.
Hospitality Growth Advisors is a team of senior operators. We read your P&L, your POS data and your invoices, then work the floor with you: menu engineering, labour modelling, prime cost control, vendor terms and the daily numbers your managers act on.
Every engagement is fixed fee and scoped after we see the numbers. We tell you when something is not worth doing. Engagements are typically structured around a 90-day measurement cycle, with progress tracked against agreed operational and margin metrics.
Texas, Florida, South Carolina and North Carolina — engagements worldwide. Book a 20-minute margin review at hospitalitygrowthadvisors.com.
What we do
The disciplines operators call us for most. New to bringing someone in? Read what a restaurant consultant actually does , or how much one costs.
The team
Three partners, one family-owned practice — senior operators on your floor, not junior analysts with a template.
Founder introduction
Busy rooms still lose money when food, beverage and labor creep past 66%. In one minute, hear why we started HGA and how a 90-day measurement cycle targets prime cost under 60%.
We started Hospitality Growth Advisors because we kept watching good restaurants run out of money with full dining rooms. Owners were paying for thick reports that described their problems back to them, and nobody stayed to fix anything. Prime cost — food, beverage and labor together — creeps to 66, 68, 70 percent. Free pours at the bar. Plates that are never weighed. Schedules built around habit instead of covers. Each leak looks small; together they eat the margin. So we work differently: senior partners on your floor and in your numbers, a fixed fee, and a 90-day measurement cycle tracked against the margin targets we agree on together. Our goal is to bring prime cost back under 60 percent and leave you with systems your team can run without us. If your room is busy and your bottom line isn't, book a 20-minute margin review.
Finance & Strategy
Builds the financial model behind every engagement — TCU honors graduate, previously Berkeley Research Group and UBS.
Food & Beverage
Army veteran and award-winning chef who has owned and run restaurants — he rebuilds the menu so every plate pays for itself.
Operations
25+ years in law enforcement and investigations, now directing the floor, line and back-office systems that hold on a short-staffed Friday.
Results
Latest insights
Average restaurant food cost runs 22–40% of sales depending on format. See the benchmarks by format, what belongs in the number, and how to close a gap.
One looks at the whole business, the other at daily execution. Here is the difference, what each one changes, and which to hire first.
Most restaurants running a prime cost above 65% are not overspending in one obvious place. They are losing two or three points each across five quiet leaks.
A first conversation is twenty minutes and costs nothing. Project engagements start at $4,000 and are fixed-fee; or keep us on a monthly cadence with a support program.